Reports
How do I read the Spending Goal graph?
Understand the Spending Goal graph, the single monthly goal line, and how Finance AI tracks spending pace across the month.
Quick answer
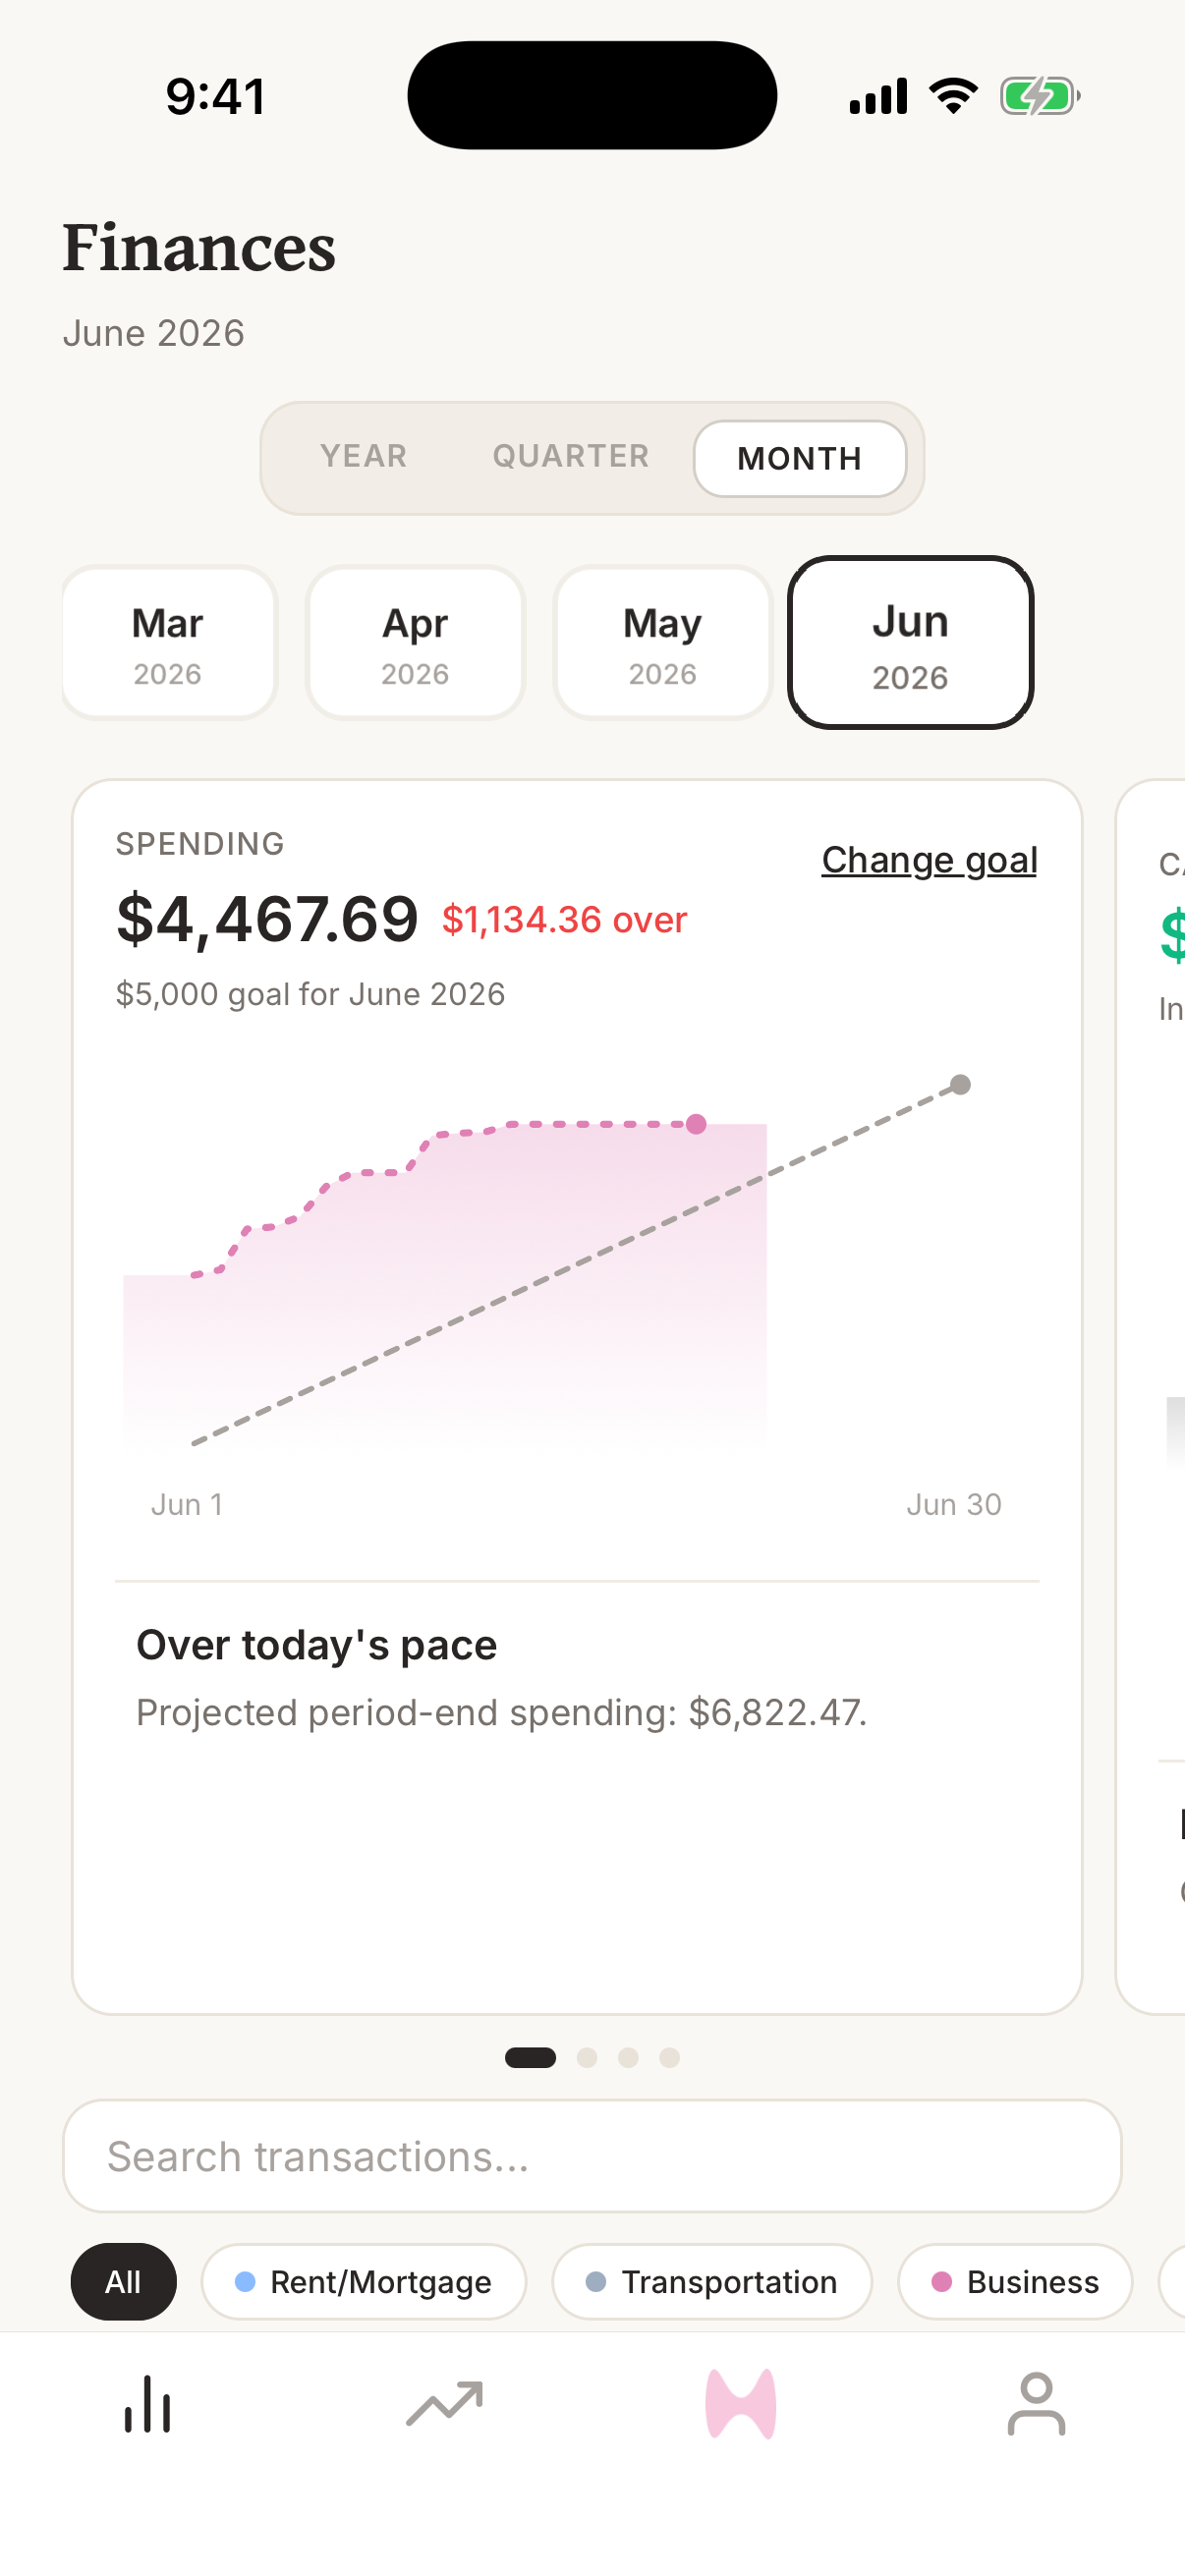
The Spending Goal graph compares your current monthly spending against one simple monthly goal. The goal line is linear across the month, so a $3,100 goal in a 31-day month equals $100 of expected spending per day.
Steps
- 1Open Finance AI on your iPhone.
- 2Go to the home screen.
- 3Swipe the graph carousel until you see Spending Goal.
- 4Read the headline amount as spending so far this month.
- 5Compare the spending line to the goal line to see whether the month is pacing above or below goal.
- 6Update your monthly spending goal from Settings if the target needs to change.
One simple monthly goal
Finance AI uses one monthly spending goal instead of many category budgets. That keeps the target easy to understand: spend less than the monthly goal overall, then use category breakdowns to learn what is driving the total.
This is meant to be simple to track from the home screen. You do not need to maintain separate goals for restaurants, groceries, subscriptions, travel, and every other category unless you want to inspect those categories later.
How the goal line is calculated
The goal line is linear over the month. Finance AI divides your monthly spending goal by the number of days in the month, then plots the expected cumulative spending for each day.
For example, if your spending goal is $3,100 and there are 31 days in the month, the goal pace is $100 per day. By day 10, the goal line is $1,000. By day 20, it is $2,000. By day 31, it is $3,100.
What counts toward the graph
The spending line uses ordinary spending transactions for the current month. Income and transfers are separated so they do not distort goal progress.
Changing a transaction date or category can move spending above or below the goal line because the transaction may move into a different month or stop counting as spending.